Prefer to watch, not read? Then head right over to check out our webinar recording for this topic: How to Harness that Power of Data: Techniques for Local Governments
Data might seem like a big new thing that you’ve heard your local government colleagues talking about. But it’s actually been around for a long time.
Most of that time, data has been on sticky notes, sheets of paper in folders, or separate computer hard drives that had no way of interacting with each other. What’s changed now is that 21st-century technology has allowed us to digitize data in new ways and compute it at speeds never before imagined.
Whether on a simple spreadsheet or through an API that connects computers in different departments, data analytics let local governments find insights that are revolutionizing how they operate, saving money, increasing accountability and enabling equity.
The possibilities of data are seemingly endless, and it can be hard to know where to get started. So we’ve collected some real-world use cases and tips from our recent webinar, How to Harness that Power of Data: Techniques for Local Governments, to help you get going today.
How three cities are putting data to work
-
New Orleans, LA: Using a simple spreadsheet to manage program performance
Managing abandoned properties is a challenge for many municipalities. In the aftermath of Hurricane Katrina, New Orleans had a long list of problem properties they needed to deal with. So they decided to take a simple approach to use data to help a working group make faster, more efficient progress in the abatement process.
As part of their BlightStat project, the city brought together a group of stakeholders to look at data in a simple spreadsheet containing various targets and goals for the program. By meeting regularly to review the data, the team could check whether they were on track. If they weren’t meeting their targets, they could talk about why that was the case and make adjustments to improve progress.
By the end of the project, the mayor at the time kept his promise of clearing nearly 10,000 problem properties. The city subsequently invested more in their data systems and personnel to further use data for program performance management.
-
Syracuse NY: Increasing operations efficiency with GIS mapping*
The City of Syracuse was using a paper-based process for park maintenance that was inefficient. So the Superintendent of Parks came to the data team and asked for help finding operational efficiencies that would reduce cost and increase performance.
The team digitized the paper-based work order system and then used GIS mapping* technology to map out where all the city’s parks were located. (The mapping process was helpful in and of itself because it required city staff to develop a comprehensive list of parks, something they didn’t previously have.)
They combined this data with another tool and the parks department had mapping technology that tied work orders to parks and showed which parts of each park needed to be serviced.
The result was that the service time went from three days per park to one day per park. And even amidst their busiest season to date, the parks team had their fewest complaints ever.
- Chicago IL: Combining data sets to achieve health outcomes
Like many cities with housing built in the 1970s and before, Chicago has a challenge with lead poisoning in children from lead-based paint flaking off the sides of older homes.
As part of its Lead Safe Chicago initiative, the city led an effort to get out in front of the long-lasting adverse health outcomes caused by this problem, the City of Chicago decided to use API technology to combine their housing lead abatement data with medical records from lead testing. The goal was to create a system that would help doctors identify kids at risk of lead poisoning before they get exposed to it.
The result was an API available to Chicago-area hospitals and health networks that estimates the likelihood of a child being exposed to lead. The program uses a machine learning model trained with historic state and city data that lets medical professionals generate a risk score for each child they treat.
Start with the problem.
As you can see, there are many ways cities can use data to improve operation and outcomes—from a simple spreadsheet to complex computing. But a challenge many municipalities face is figuring out how to get started working with data.
The best place to begin is by identifying a problem that needs to be solved. By working with staff to figure out their biggest challenges, you can identify what data is available that can be analyzed to help solve the problem.
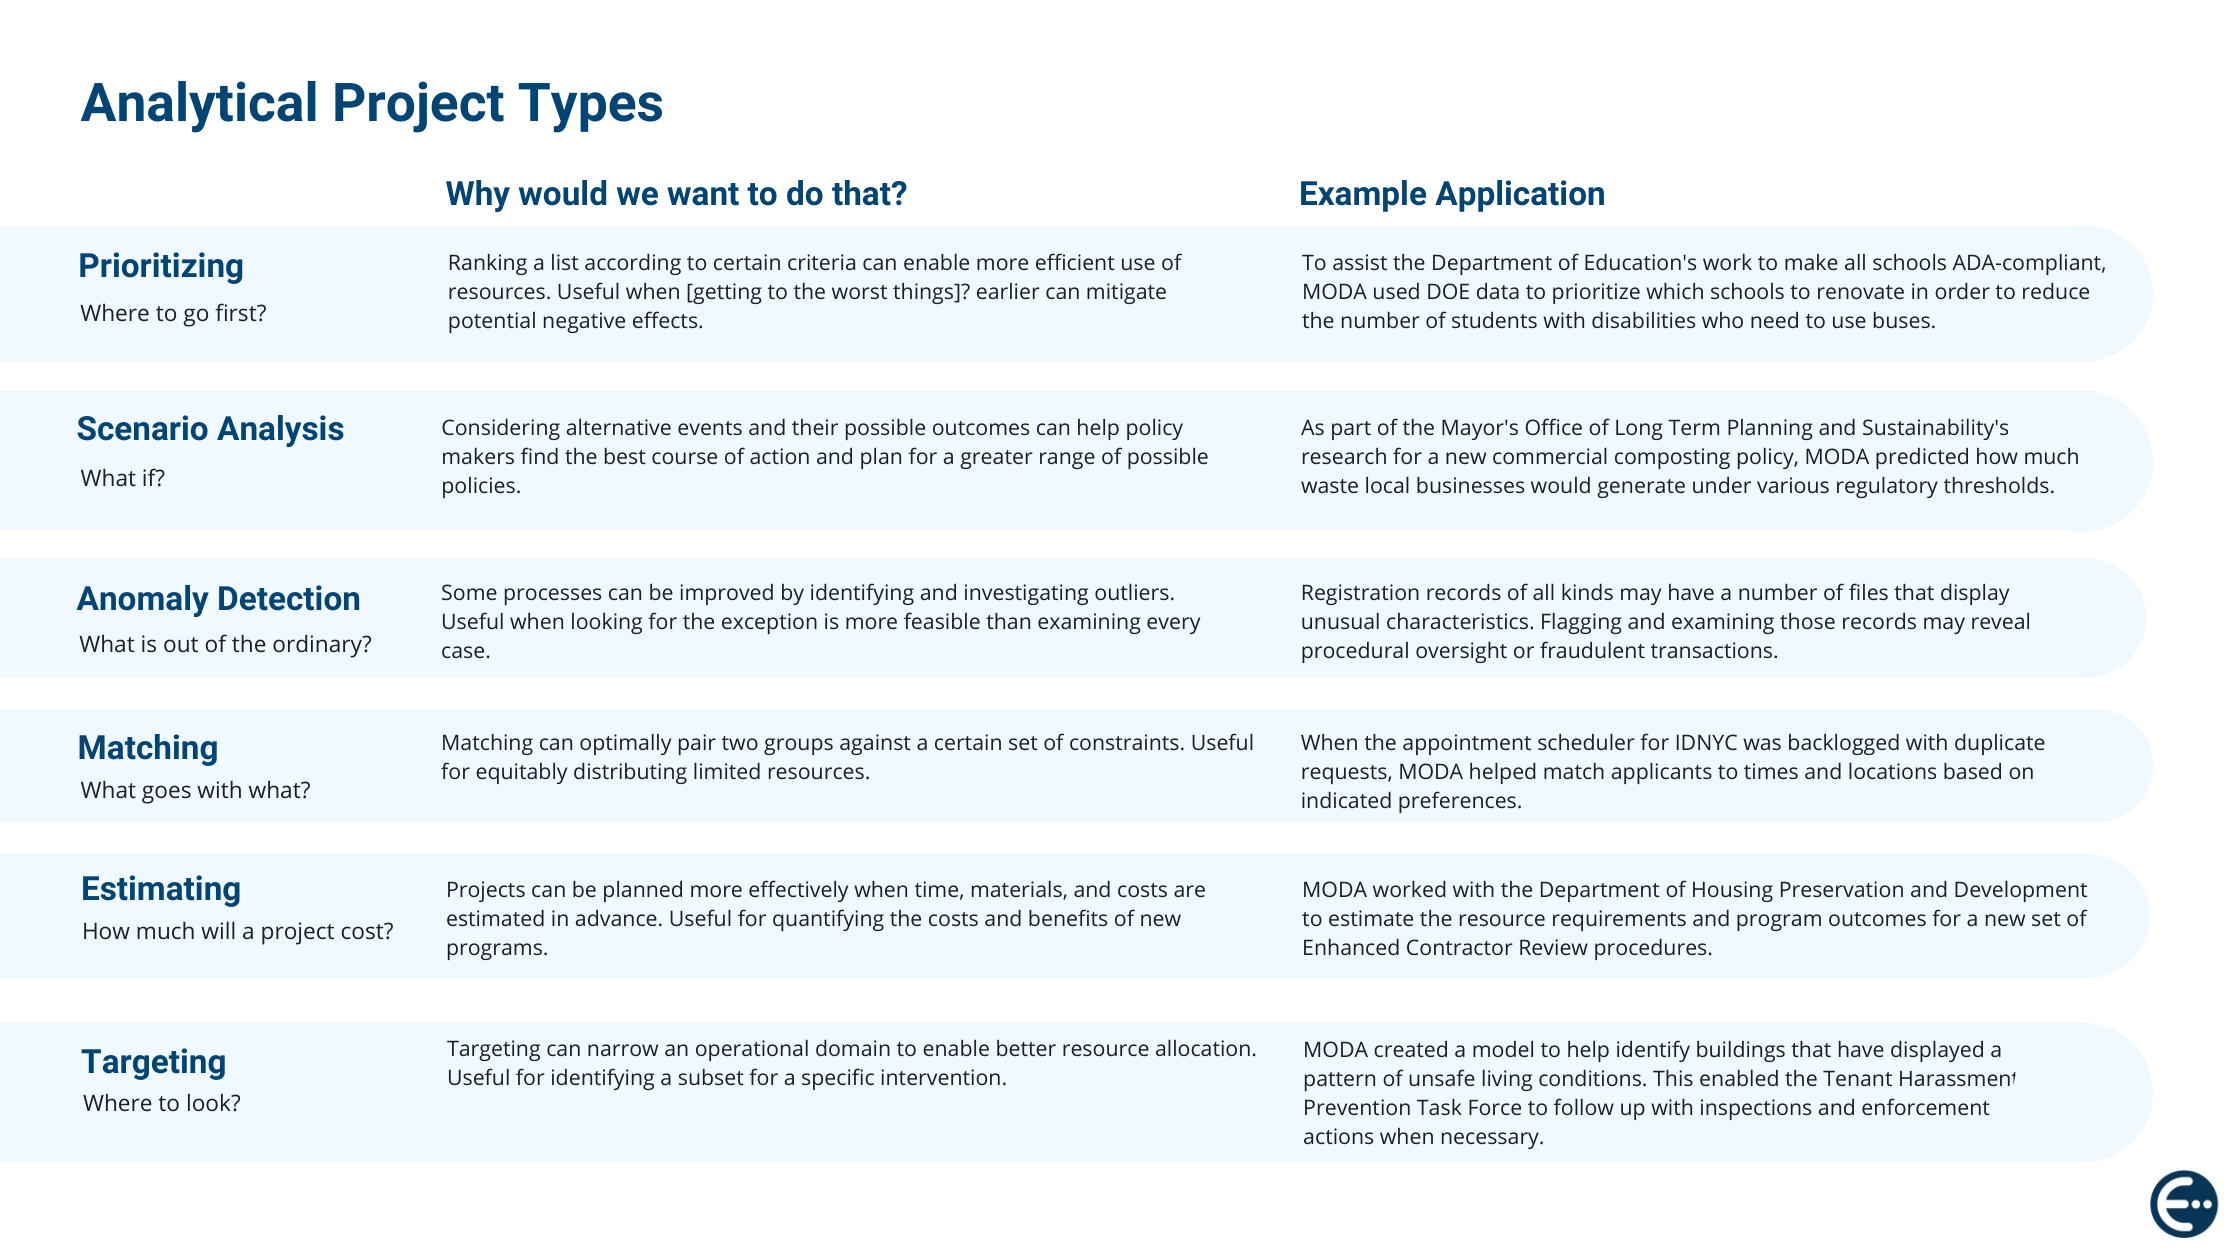
Below is a chart with some analytical models that give examples of the kinds of problems you could use data to solve.
Show value to gain support for your initiative.
After you’ve identified the problem, you may need to make a case to your team showing why it’s important to invest in analytics so you can get executive buy-in for resources.
Here are some ways you can identify and measure value from your data projects:
- Fraud detection cost savings
- Efficiency improvements that reduce costs
- Accuracy improvements that reduce costs
- Increased revenue capture
- Efficiency improvements that improve outcomes
- Operational changes that increase safety
- Increased faith in government due to more transparency
Build your team and systems
If you’re successful in proving the value of your initiative, the next step is to bring in the people and technology that can help you execute effectively.
That could mean bringing in a data analyst who can help you understand what insights you can get from data and a data engineer who can help you sustainably extract the data you need to be analyzed. Larger cities also frequently add the role of a Chief Data Officer, who oversees all data operations to ensure they run smoothly.
Most municipalities have data that are spread out across multiple systems, both digital and paper. So you’ll also need to look at how those systems can be connected to let you make the best use of the data and analyze it effectively. Many cities are approaching this problem by investing in cloud capabilities that let all their information live in a single place online.
Then there’s data governance. As you start putting more data together, projects get more complex, and things can go wrong. So any data project needs to meet privacy guidelines, and algorithms need to be governed to ensure they operate equitably.
Begin where you are
All of the above might sound a bit daunting, especially if you are part of a small municipality just thinking about getting started with data. But don’t worry. You don’t need to make a huge investment to get data working for your organization.
It may just be a matter of empowering people in your organization who are already experimenting with this kind of work but don’t have the support they need to move the projects forward.
If you find one of these often-hidden people and tie the work they’re doing to your local government’s priorities, you can then give them the resources they need to succeed. With one successful case study under your belt, you can then go out and look for funding to do similar projects.
If you’re delving into this kind of data work, it’s important to also ensure you get executive sponsorship so senior leaders can own the sometimes complicated decisions that arise when you start sharing data. Having this kind of buy-in will ensure you get the support you need to keep initiatives moving forward.
It may take longer than you expect to get the data ball rolling in your municipality. But don’t get discouraged. Just keep working at it and showing value. Eventually, your efforts will pay off.
More Resources:
Report: The Case for Government Investment in Analytics
Don't have time or resources to collect, analyze and present your community engagement data? We can help. Contact us to learn more.